How to Graph Any Function Using Geogebra, Desmos Graphing, and Wolfram Alpha
Author: Apolinario "Sam" Ortega, founder of IN-V-BAT-AI
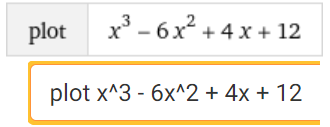
Simply enter in input box as is: x ^3 + 6x^2 + 11x +6 . Remember use the caret symbol ^ for exponent.
By Apolinario "Sam" Ortega, 14 January 2013, Created with GeoGebra
Transformer Through Fault Duration
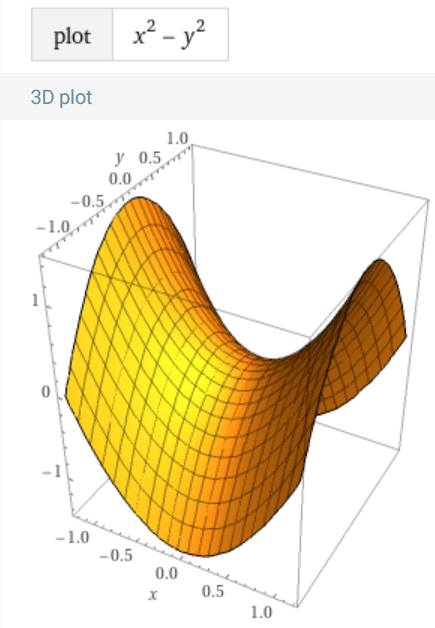
Another 3D Plot
Graphing Piecewise Function
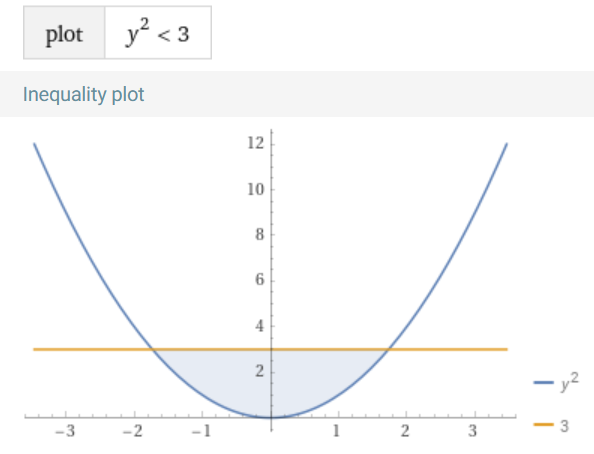
Graphing Inequality Function
Graphing Inequality Function
Graphing Only Positive x and y values
Graphing Combination of functions
130% plus or minus above normal waveform
Plotting Using Wolfram Alpha Click the link to view the plot
polar plot r = 1 + cos θ
visualize a number line 2, 3, 5, 7, 11, 13
visualize a number line -5, -3, 0, 2, 3, 5, 7, 11, 13
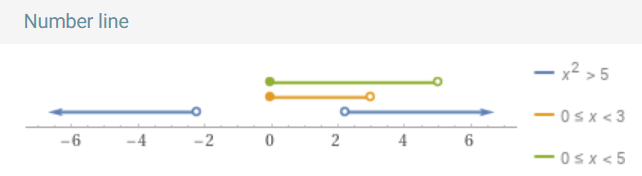
draw multiple number line x2 > 5 , 0 < = x < 3
How to plot inequalities x2 + y2 < 1 and y > x

How to plot parametric plot (cos3 t , sin3 t )
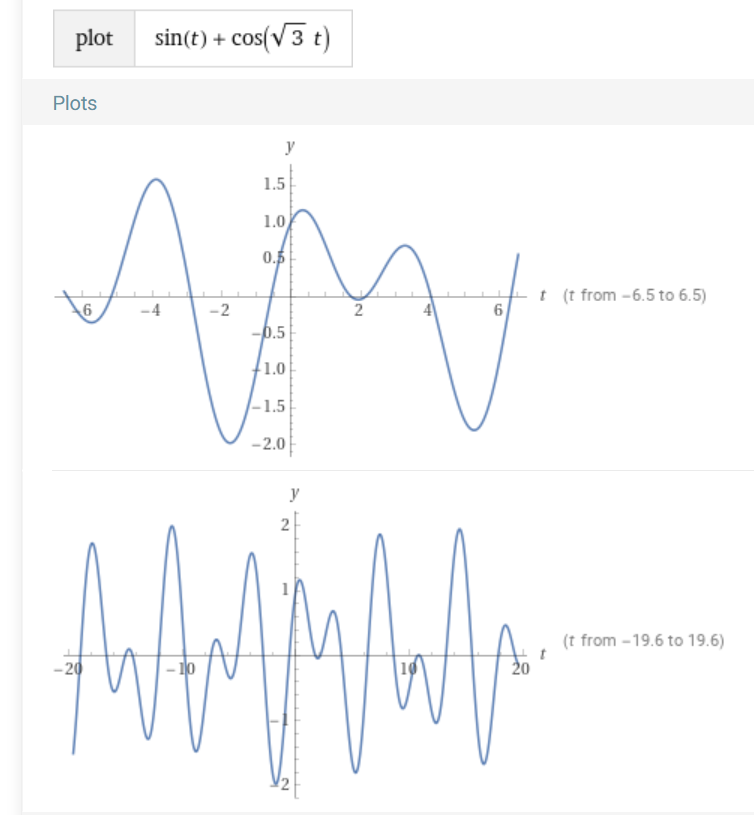
graph sin t + cos (sqrt(3)t)
plot3d Re[sin(1/(x+i y))] from x = -1/pi to 1/pi, y = -1/pi to 1/pi
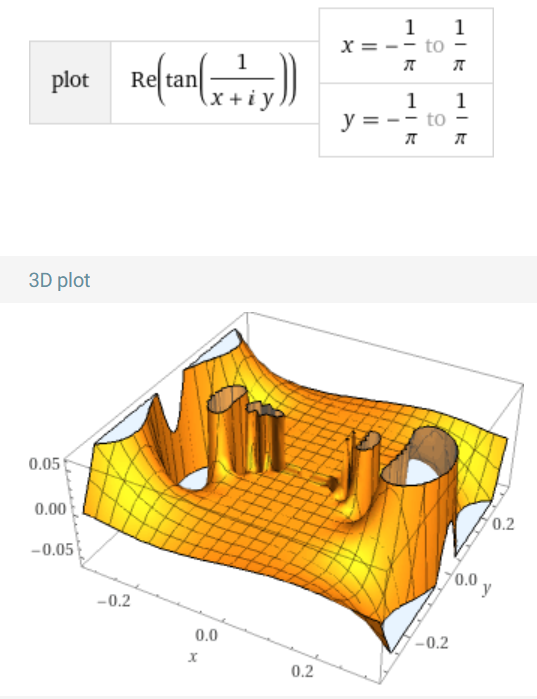
plot3d Re[tan(1/(x+i y))] from x = -1/pi to 1/pi, y = -1/pi to 1/pi
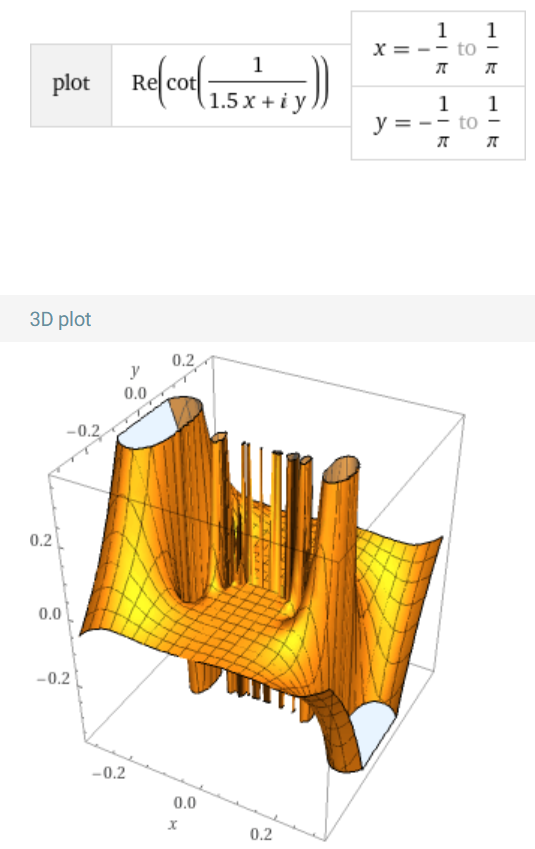
plot3d Re[cot(1/(1.5x+i y))] from x = -1/pi to 1/pi, y = -1/pi to 1/pi
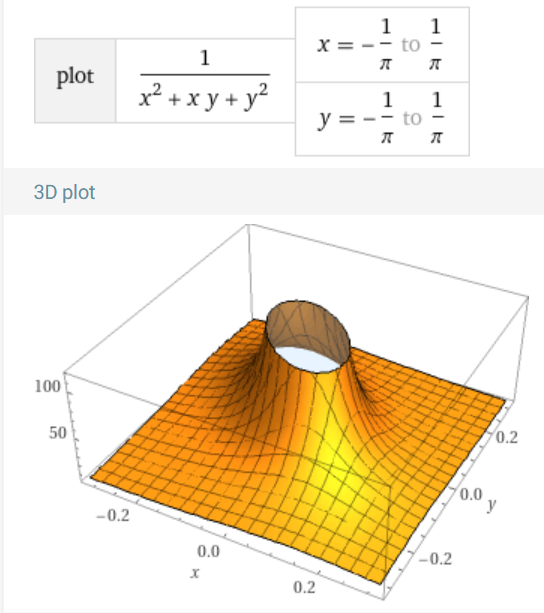
plot3d 1/(x^2+ xy+ y^2) from x = -1/pi to 1/pi, y = -1/pi to 1/pi
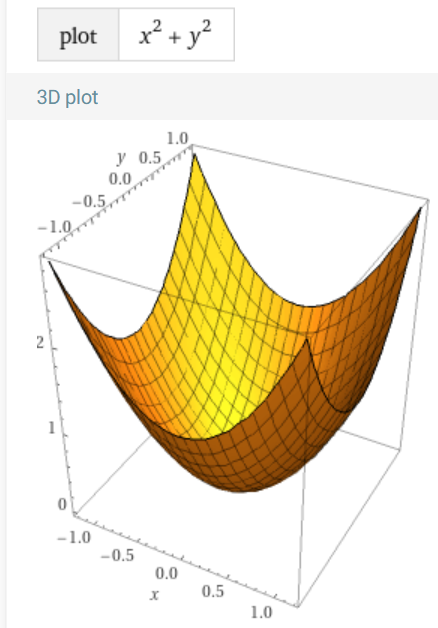
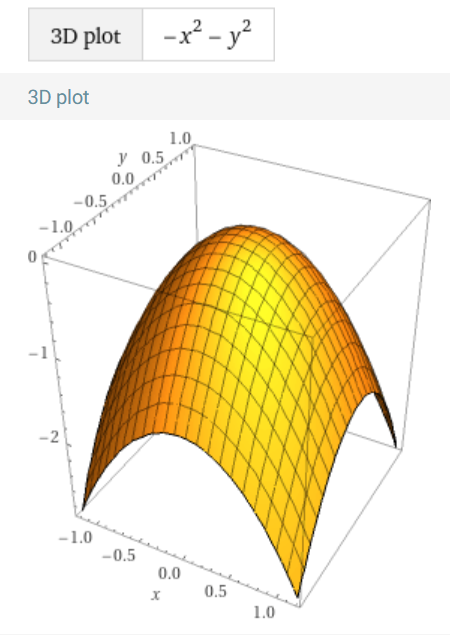
plot 3d (-x^2-y^2)
Three dimensional plots typically display a surface defined by a function in two variables,
z = f(x, y)
polar plot r = 1 + cos θ
visualize a number line 2, 3, 5, 7, 11, 13
visualize a number line -5, -3, 0, 2, 3, 5, 7, 11, 13
draw multiple number line x2 > 5 , 0 < = x < 3
How to plot inequalities x2 + y2 < 1 and y > x
How to plot parametric plot (cos3 t , sin3 t )
graph sin t + cos (sqrt(3)t)
plot3d Re[sin(1/(x+i y))] from x = -1/pi to 1/pi, y = -1/pi to 1/pi
plot3d Re[tan(1/(x+i y))] from x = -1/pi to 1/pi, y = -1/pi to 1/pi
plot3d Re[cot(1/(1.5x+i y))] from x = -1/pi to 1/pi, y = -1/pi to 1/pi
plot3d 1/(x^2+ xy+ y^2) from x = -1/pi to 1/pi, y = -1/pi to 1/pi
plot 3d (-x^2-y^2)
Three dimensional plots typically display a surface defined by a function in two variables,
z = f(x, y)
IN-V-BAT-AI helps you recall information on demand—even when daily worries block your memory. It organizes your knowledge to make retrieval and application easier. 🔗
Source: How People Learn II: Learners, Contexts, and Cultures
Copyright 2025
Never Forget with IN-V-BAT-AI
INVenting Brain
Assistant Tools
using Artificial Intelligence
(IN-V-BAT-AI)
Since
April 27, 2009
April 27, 2009