.
👈


📱 Launch 504 Custom Educational Websites for Just $30/Year
No coding. No hosting. Just results.
Empower your classroom, tutoring service, or educational platform with 200 custom calculators and 304 math exam tutor sites—all hosted and maintained for you. That’s 504 personalized tools for just 6 cents each per year.
✅ Zero technical setup
Just email us what you want updated—we’ll handle the rest.
✅ Instant deployment
Your tools go live fast, optimized for mobile and voice search.
✅ Built for learning
Designed to support memory recall, personalized study, and exam prep.
🎯 Who It’s For
Teachers who want ready-to-use digital tools
Tutors scaling their services without tech overhead
Students needing reliable, on-demand study aids
Anyone who believes learning should be accessible and affordable
Never forget. Always be ready.
With IN-V-BAT-AI, your knowledge lives in the cloud—ready when you are.

IN-V-BAT-AI solution to forgetting! No coding. No website hosting.
Remember on demand is now possible!

Using AI - Voice to Text Keyword, Phrases or Number Type here > tap SEARCH 2
Transformer Bushing Reviewer
Related topic: Transformer overall power factor
TABLE 1 SHOWN BELOW IS THE GIVEN STATISTICAL DATA FOR ANALYSIS
THESE NUMBERS ARE NOT BASED ON REAL DATA, SHOWN FOR EDUCATIONAL PURPOSES ONLY.
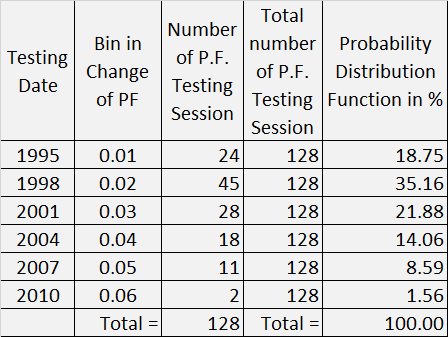
FIGURE 2 Data from TABLE 1 is converted to histogram

FIGURE 3 Histogram is Converted to Probability Distribution Function

Using Weibull 2-parametric Probability Distribution Function
It appears Characteristic life, Eta, is able to predict the 3 years time interval based on test report data.
Slope beta , b > 1, able to predict normal deterioration due to wear and tear.
The bushing is in service for 15 years at time of the last testing date then it fails. So the predicted failure time which is 6 unit scale x 3 years interval per testing date (18 years predicted actual is 15 years) is very close to the real data set.
Is the application of the Weibull PDF correct or wrong? Explain why it is correct or why it is wrong?


FIGURE 4 Probability Distribution Function Shown in 3D Bubble Graph with Focus Bushing that has change of power factor from nameplate that is an outlier from the 128 bushing testing session history
Figure 4 above is using the visual display analysis looking only for an outlier bushing from the population.
If there is no outlier , it is hard to list all the bushings that are behaving differently from the rest of population. Central tendency method using mean and standard deviation will be the next logical method to find the list of bushing that need more attention.
Next step after having the list of bushing that needs more attention is using the trending analysis of power factor measurement, capacitance measurement, and watt measurement.
Finally additional tool such as Weibull Analysis of bushing failure will be helpful to prioritize the bushing overall strategy.
IMPORTANT: DON'T FORGET TO SEEK ADVICE FROM YOUR BUSHING VENDOR AND POWER FACTOR TEST INSTRUMENT VENDOR THEY ARE YOUR PARTNER.
By automating the data collection and statistical analysis, transformer engineer will have the necessary tool to monitor new Power Factor test measurement of transformer bushing for any outlier or listing of 2 or 3 standard deviation from their population of transformer bushing fleet to generate the list of bushing for more detailed analysis using trending method. This insight in turn will trigger maintenance strategy, operation strategy, replacement strategy, specification update, vendor management, purchasing strategy, and financial planning.
FIGURE 5 Oil Impregnated Paper Condenser Bushing That Has Internal Geometry Problem
FIGURE 6 Oil Impregnated Paper Condenser Bushing That Has Growing Contamination Problem

If NaN or infinity message shows up, ignore it. Continue entering your data.
Formula Recall: (%)PF = (test data in watts x 10) / test data in mA
The calculator use in EQUATION 1 accounts for the multiplication of 10 to get the power factor express in percentage, see Figure 4 below for derivation of formula.
Enter your Doble M4100 Test report reading below. This equation is VALID if your Applied TEST VOLTAGE is 10 kV. If your Applied TEST VOLTAGE is 2 kV. Then your multiplying should be 50 instead of 10. See figure 4 below to see the derivation of the formula
EQUATION 1
|
Measured PF in (%)
| = |
X 10 test data in Watts
test data in mA, total charging current, It
|
Capacitance ( in pF) = test data in mA x 265 EQUATION 2

![]()
Remember capacitance measurement is in picoFarad (pF) and it is directly proportional to Doble M4000 test data in mA , see EQUATION 2 above. Assuming the Doble M4000 test data in watts has very small variations for three years assuming that is your time based maintenance interval.
A transformer that suffered deformation on its windings and core geometry due to internal fault will usually show downward trending of capacitance reading value.
Capacitance Downward Trend

A perfect insulator or capacitor has a power factor reading of 0 % (% P.F = 0 ) as shown by mathematical computation but not in real world application. Try EQUATION 1 and do a simulation by increasing the total charging current It = 70 mA, or until the power factor reading is 0.0851 %. You will notice that you will get a very high capacitance reading value = 18,550 picoFarad ( pF ) therefore confirming the mathematical EQUATION 1 of a perfect insulator or capacitor has a power factor reading of approximately equal to zero ( 0 ) % P.F.
Assuming you have a baseline capacitance value of your transformer during factory test and your historical capacitance reading is trending downward therefore it is a warning indicator that internal damage in winding or core is possible provided your watts reading is almost constant.
Memory recall capacitance formula = ( Area * dielectric constant )/ (12.57 * distance between plates).
Looking at the capacitance formula (see Figure 6 below) it is easy to see that decreasing Area and increasing distance between plates can cause the capacitance value reading to trend downward. Hence it is a good warning indicator that something is changed in winding and/or core geometry possibly from withstanding external transient fault overcurrent from transmission lines and internal transformer fault.
A strong impact during delivery of transformer to a site location enough to deform the internal geometry of a transformer will also exhibit a downward trending in capacitance reading value. Again looking at the capacitance formula, the plate area of capacitor referring to representation model might shrink or deformed due to a large gravitational force during installation or due to a large acceleration force during delivery and hence lowering the calculated value of Area. Since Area is directly proportional to capacitance value any reduction in Area will be captured by the downward trending of the capacitance reading.
A transformer that has lots of contaminants on its insulating oil and paper will usually show an increasing trend of watts reading value and also increasing power factor (%) reading. Example of contaminants to oil and papers are moisture, arcing byproducts and metallic particles from forced oil motors.
Watts trending upward


Moisture or water is known as polar (molecule) contaminants referring to chemical definition of polar molecule. Polar molecules can be easily understood by drawing its atomic outer orbit. When electron in outer orbit are shared by another atom we say polar bonding happen (hence called polar molecule). Why this knowledge is important in oil contamination analysis? As you can see there are 6 more free electrons from the oxygen atom that can be attracted by copper atoms in winding, iron atom in lamination, and steel plate frame support. Remember oxidation is loss of electrons.The drawing below is helpful to see that oxygen molecules is the source of that loss of electrons.
To prevent the copper atoms and iron atom to attract the free electrons from oxygen we add inhibitor in our oil. What it does is the free electrons from oxygen will bond first on these inhibitor therefore preventing it to bond on copper winding, laminated steel sheet, and steel frame support. So next time you read your oxygen report from DGA analysis try to see also your required inhibitor to protect your copper winding, iron steel plates, and lamination from oxidation.

Try a simulation by increasing the wattage reading using the above calculator and you will see the increase of power factor (P.F.) reading as wattage reading is increased.
Sample measured test data for hands on practice
Test # 1 mA minus Test # 2 mA.
Next Test # 1 watts - Test #2 watts.
Next compute P.F% using Equation 1. Manual calculation P.F.% is use to check line 3 P.F % values.
Test # 5 mA minus Test # 6 mA.
Next Test # 5 watts - Test #6 watts.
Next compute P.F% using Equation 1. Manual calculation P.F.% is use to check line 7 P.F % values.
CHL is the dielectric insulation between High Side Windings , lumped sum area as upper plate and Low Side Windings, lumped sum area as lower plate in capacitance model. It is also called inter winding insulation.


FIGURE 1

FIGURE 2
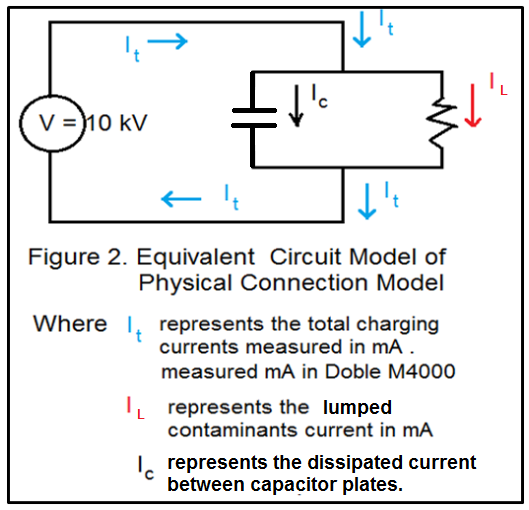
In a perfect insulator or capacitor, electrical current cannot actually flow through between two conductive plates because the dielectric material between two plates would not allow it. But due to contaminants there is an internal leakage current flowing between plates through these contaminants. These contaminants are due to moisture ingress inside the main tank of a transformer because of worn out gaskets in bushings and other gasketed interface connection, arcing byproducts, and metallic particles. Doble Test #2. (CH) and Doble Test #6 (CL) are example of these insulator or capacitor. Test #2 CH - INSULATION testing is about measuring the total leakage current flowing through contaminants between the high voltage winding as plate #1 and grounded tank is the plate # 2 . The dielectric materials between the two capacitor plates model are the thermally upgraded kraft papers used to cover each rectangular high voltage winding conductor plus the insulating oil. The possible contaminants are moisture, arcing byproduct and metallic particles that can be absorbed by kraft papers and oil.
During Overall Test of power transformer using Doble M4000 series test instrument the H1-H2-H3 bushings are shorted and are energized by 10 kV voltage source and there is a safe leakage current flowing through these contaminant and return to the ground. The value of these safe leakage current is in mA. Refer to Figure 1 , Figure 2 and sample test data for Test #2, the total leakage current is 9.077 mA.
FIGURE 3

FIGURE 4
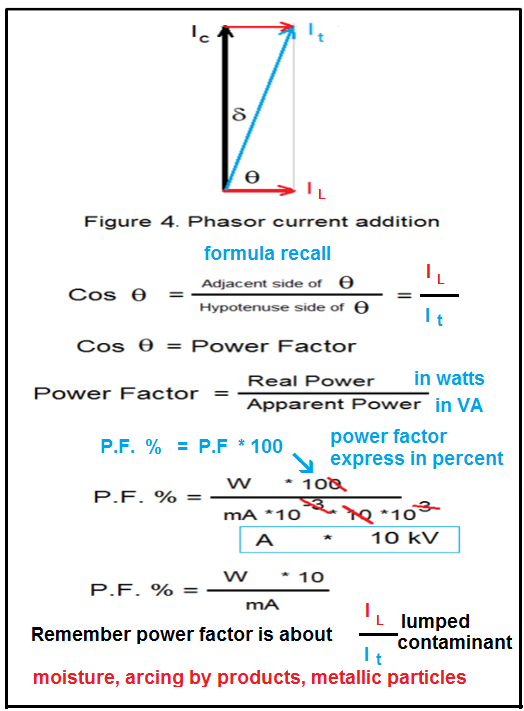
FIGURE 5

FIGURE 6

Credit: Doble Engineering
Formula Recall: (%)PF = (test data in watts x 10) / test data in mA
Formula Recall: Capacitance (in picoFarad) = test data in mA x 265
.
IN-V-BAT-AI helps you to remember on demand even if your memory recall is block by too much worries of daily life. It helps you to organize knowledge in ways that facilitate retrieval and easy to use immediately.
Source: How People Learn II: Learners, Contexts, and Cultures
.
How can IN-V-BAT-AI be used in classrooms ?
The IN-V-BAT-AI solution can be a valuable tool in classrooms, enhancing both teaching and learning experience. Here are some ways it can be utilized:
⋆ Personalized Learning : By storing and retrieving knowledge in the cloud, students can access tailored resources and revisit
concepts they struggle with, ensuring a more individualized learning journey.
⋆ Memory Support : The tool helps students recall information even when stress or distractions hinder their memory, making it
easier to retain and apply knowledge during homework assignments or projects.
⋆ Bridging Learning Gaps : It addresses learning loss by providing consistent access to educational materials, ensuring that
students who miss lessons can catch up effectively.
⋆ Teacher Assistance : Educators can use the tool to provide targeted interventions to support learning.
⋆ Stress Reduction : By alleviating the pressure of memorization, students can focus on understanding and applying concepts,
fostering a deeper engagement with the material.
.


.
.
Try AI website hosting
$30 per year
| Year | Top 10 countries | Pages visited |
| 2023 | 1. USA 2. Great Britain 3. Germany 4. Canada 5. Iran 6. Netherlands 7. India 8. China 9. Australia 10. Philippines | 127,256 Pages / 27,541 Visitors |
| 2024 | 1. USA 2. China 3. Canada 4. Poland 5. India 6. Philippines 7. Great Britain 8. Australia 9. Indonesia 10. Russia | 164,130 Pages / 40,724 Visitors |
| Daily Site Visitor Ranking 7/19/2025 | 1. USA 2. India 3. Canada 4. Iran 5. Latvia 6. Russia 7. Lithuania 8. Polan 9. Brazil 10. China | Year to Date 106,254 Pages / 32,111 Visitors |
Data source: Advanced Web Statistics 7.8