.
👈


📱 Launch 504 Custom Educational Websites for Just $30/Year
No coding. No hosting. Just results.
Empower your classroom, tutoring service, or educational platform with 200 custom calculators and 304 math exam tutor sites—all hosted and maintained for you. That’s 504 personalized tools for just 6 cents each per year.
✅ Zero technical setup
Just email us what you want updated—we’ll handle the rest.
✅ Instant deployment
Your tools go live fast, optimized for mobile and voice search.
✅ Built for learning
Designed to support memory recall, personalized study, and exam prep.
🎯 Who It’s For
Teachers who want ready-to-use digital tools
Tutors scaling their services without tech overhead
Students needing reliable, on-demand study aids
Anyone who believes learning should be accessible and affordable
Never forget. Always be ready.
With IN-V-BAT-AI, your knowledge lives in the cloud—ready when you are.

IN-V-BAT-AI solution to forgetting! No coding. No website hosting.
Remember on demand is now possible!

Using AI - Voice to Text Keyword, Phrases or Number Type here > tap SEARCH 2
Probability Density Function
Author: Apolinario "Sam" Ortega, founder of IN-V-BAT-AI
PROBABILITY DENSITY FUNCTION AND HISTOGRAM APPLICATION IN REAL WORK OF AN ELECTRICAL POWER ENGINEER
FIGURE 1 IS THE STATISTICAL DATA FOR ANALYSIS
THESE NUMBERS ARE NOT BASED ON REAL DATA, SHOWN FOR EDUCATIONAL PURPOSES ONLY.
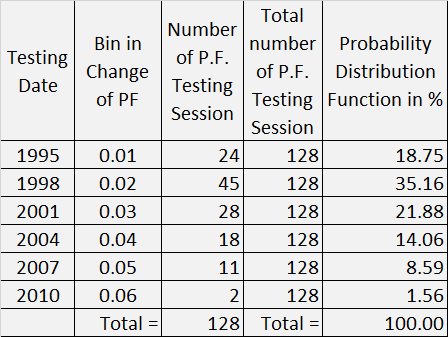
FIGURE 2 Data is Converted to Histogram

FIGURE 3 Histogram is Converted to Probability Distribution Function

Using Weibull 2-parametric Probability Distribution Function
It appears Characteristic life, Eta, is able to predict the 3 years time interval.
Slope beta , b > 1, able to predict normal deterioration due to wear and tear.
The bushing is in service for 15 years at time of the last testing date.
FIGURE 4 Probability Distribution Function Shown in 3D Bubble Graph with Focus Bushing that has change of power factor from nameplate that is an outlier from the 128 bushing testing session history
Figure 4 above is using the visual display analysis looking only for an outlier bushing from the population.
If there is no outlier , it is hard to list all the bushings that are behaving differently from the rest of population. Central tendency method using mean and standard deviation will be the next logical method to find the list of bushing that need more attention.
Next step after having the list of bushing that needs more attention is using the trending analysis of power factor measurement, capacitance measurement, and watt measurement.
Finally additional tool such as Weibull Analysis of bushing failure will be helpful to prioritize the bushing overall strategy.
IMPORTANT: DON'T FORGET TO SEEK ADVICE FROM YOUR BUSHING VENDOR AND POWER FACTOR TEST INSTRUMENT VENDOR THEY ARE YOUR PARTNER.
FIGURE 5 Trending Analysis of Capacitance Reading Valid For OIP Bushing Only
FIGURE 6 Trending Analysis of Watt Reading Valid For OIP Bushing Only
By automating the data collection and statistical analysis, transformer engineer will have the necessary tool to monitor new Power Factor test measurement of transformer bushing for any outlier or listing of 2 or 3 standard deviation from their population of transformer bushing fleet to generate the list of bushing for more detailed analysis using trending method. This insight in turn will trigger maintenance strategy, operation strategy, replacement strategy, specification update, vendor management, purchasing strategy, and financial planning.
.
IN-V-BAT-AI helps you to remember on demand even if your memory recall is block by too much worries of daily life. It helps you to organize knowledge in ways that facilitate retrieval and easy to use immediately.
Source: How People Learn II: Learners, Contexts, and Cultures
.
How can IN-V-BAT-AI be used in classrooms ?
The IN-V-BAT-AI solution can be a valuable tool in classrooms, enhancing both teaching and learning experience. Here are some ways it can be utilized:
⋆ Personalized Learning : By storing and retrieving knowledge in the cloud, students can access tailored resources and revisit
concepts they struggle with, ensuring a more individualized learning journey.
⋆ Memory Support : The tool helps students recall information even when stress or distractions hinder their memory, making it
easier to retain and apply knowledge during homework assignments or projects.
⋆ Bridging Learning Gaps : It addresses learning loss by providing consistent access to educational materials, ensuring that
students who miss lessons can catch up effectively.
⋆ Teacher Assistance : Educators can use the tool to provide targeted interventions to support learning.
⋆ Stress Reduction : By alleviating the pressure of memorization, students can focus on understanding and applying concepts,
fostering a deeper engagement with the material.
.


.
.
Try AI website hosting
$30 per year
| Year | Top 10 countries | Pages visited |
| 2023 | 1. USA 2. Great Britain 3. Germany 4. Canada 5. Iran 6. Netherlands 7. India 8. China 9. Australia 10. Philippines | 127,256 Pages / 27,541 Visitors |
| 2024 | 1. USA 2. China 3. Canada 4. Poland 5. India 6. Philippines 7. Great Britain 8. Australia 9. Indonesia 10. Russia | 164,130 Pages / 40,724 Visitors |
| Daily Site Visitor Ranking 7/19/2025 | 1. USA 2. India 3. Canada 4. Iran 5. Latvia 6. Russia 7. Lithuania 8. Polan 9. Brazil 10. China | Year to Date 106,254 Pages / 32,111 Visitors |
Data source: Advanced Web Statistics 7.8