.
👈


📱 Launch 504 Custom Educational Websites for Just $30/Year
No coding. No hosting. Just results.
Empower your classroom, tutoring service, or educational platform with 200 custom calculators and 304 math exam tutor sites—all hosted and maintained for you. That’s 504 personalized tools for just 6 cents each per year.
✅ Zero technical setup
Just email us what you want updated—we’ll handle the rest.
✅ Instant deployment
Your tools go live fast, optimized for mobile and voice search.
✅ Built for learning
Designed to support memory recall, personalized study, and exam prep.
🎯 Who It’s For
Teachers who want ready-to-use digital tools
Tutors scaling their services without tech overhead
Students needing reliable, on-demand study aids
Anyone who believes learning should be accessible and affordable
Never forget. Always be ready.
With IN-V-BAT-AI, your knowledge lives in the cloud—ready when you are.

IN-V-BAT-AI solution to forgetting! No coding. No website hosting.
Remember on demand is now possible!

Using AI - Voice to Text Keyword, Phrases or Number Type here > tap SEARCH 2
Find Peak to Peak Voltage
Graphing Peak to Peak Voltage
y(x) = 17.63 sin(x)
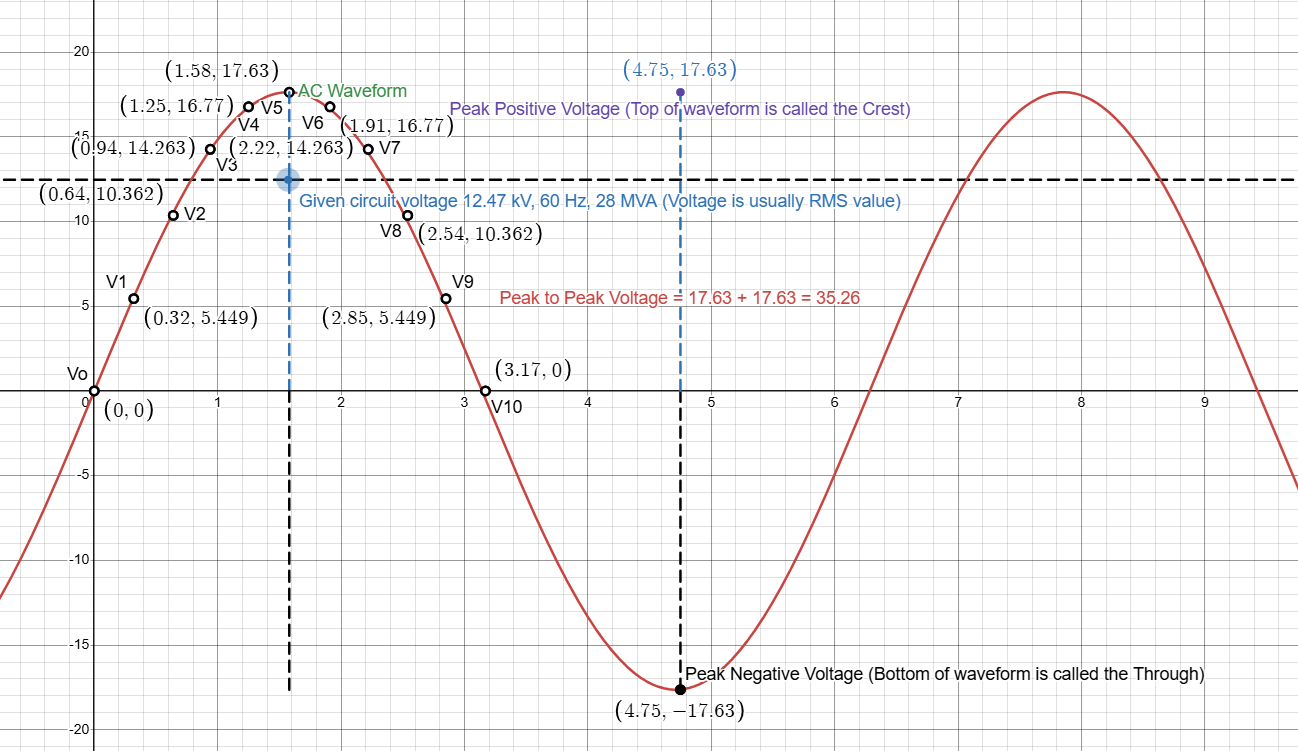
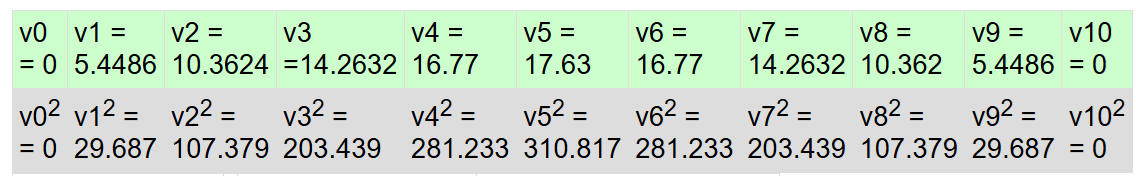
Figure 1. Image created using Desmos graphing
Top of waveform is called Crest and bottom of waveform is called Through
credit to : Desmos Graphing by Sam Ortega 8/16/2019
Instruction on how to edit using Desmos Graphing: Click the lower right icon "edit graph on desmos"
What is the magnitude of the peak to peak voltage ?
Answer Peak to Peak = 2 x Peak
17.63 x 2 = 35.26kV or 35.3 kV
Remember voltages given in apparatus specification are always assume RMS value. For example 120 Vac ( it is assume to be rms value, always think of horizontal dash straight line not sine wave, RMS is also the voltmeter reading).
The table below is an example of how to calculate the RMS value of a sine waveform given a 1/2 cycle data points (10 points) see above image Figure 1.
The RMS method can calculate any distorted waveform during harmonic injection or fault event where the waveform is not perfectly sine wave.
| Sum of all voltage square = 1554.293 | To get the mean square divide sum of all voltage square by number of data points 1554.293 / 10 = 155.4293 |
Then get the square root of the mean (rms) = √ 155.4293 = 12.467 rms value is always a constant value over half cycle time interval , represented by the horizontal dash line |
For one cycle, simply double the 1/2 cycle you will get 2 x 1554.293 = 3108.586 and double the data points = 10 x 2 = 20. Finally 3108.586/20 = 155.4293 and you will get the same rms value of 12.467. You can double or triple the 1/2 cycle as long as the waveform is purely sine wave not distorted. If the waveform is distorted you need to do the actual process of calculating the rms value up to data points that you are analyzing.
Peak to Peak Voltage
![]()

peak × = Peak to Peak
Peak Voltage
![]()
rms × = Peak Voltage
RMS Voltage = Peak / (√ 2 = 1.414) the factor 1.414 is applied only for a non distorted sine wave. You can't use this 1.414 factor to calculate the Peak voltage during transient event or short circuit fault event because the sine waveform is very distorted.
Also very important to check if the multimeter is capable of measuring TRUE RMS value. It means the multimeter is using actual data points in the waveform and has square root of mean square algorithm.
![]()
peak ÷ = RMS
Voltage Line to Ground(LG) = Voltage LL / (√ 3 = 1.732)
![]()
÷ = Voltage LG
.
IN-V-BAT-AI helps you to remember on demand even if your memory recall is block by too much worries of daily life. It helps you to organize knowledge in ways that facilitate retrieval and easy to use immediately.
Source: How People Learn II: Learners, Contexts, and Cultures
.
How can IN-V-BAT-AI be used in classrooms ?
The IN-V-BAT-AI solution can be a valuable tool in classrooms, enhancing both teaching and learning experience. Here are some ways it can be utilized:
⋆ Personalized Learning : By storing and retrieving knowledge in the cloud, students can access tailored resources and revisit
concepts they struggle with, ensuring a more individualized learning journey.
⋆ Memory Support : The tool helps students recall information even when stress or distractions hinder their memory, making it
easier to retain and apply knowledge during homework assignments or projects.
⋆ Bridging Learning Gaps : It addresses learning loss by providing consistent access to educational materials, ensuring that
students who miss lessons can catch up effectively.
⋆ Teacher Assistance : Educators can use the tool to provide targeted interventions to support learning.
⋆ Stress Reduction : By alleviating the pressure of memorization, students can focus on understanding and applying concepts,
fostering a deeper engagement with the material.
.


.
.
Try AI website hosting
$30 per year
| Year | Top 10 countries | Pages visited |
| 2023 | 1. USA 2. Great Britain 3. Germany 4. Canada 5. Iran 6. Netherlands 7. India 8. China 9. Australia 10. Philippines | 127,256 Pages / 27,541 Visitors |
| 2024 | 1. USA 2. China 3. Canada 4. Poland 5. India 6. Philippines 7. Great Britain 8. Australia 9. Indonesia 10. Russia | 164,130 Pages / 40,724 Visitors |
| Daily Site Visitor Ranking 7/19/2025 | 1. USA 2. India 3. Canada 4. Iran 5. Latvia 6. Russia 7. Lithuania 8. Polan 9. Brazil 10. China | Year to Date 106,254 Pages / 32,111 Visitors |
Data source: Advanced Web Statistics 7.8