


Advertisement

Advertisement
How do you like the idea of NOT saying " Oh I forgot, let me get back to you. "
Advertisement
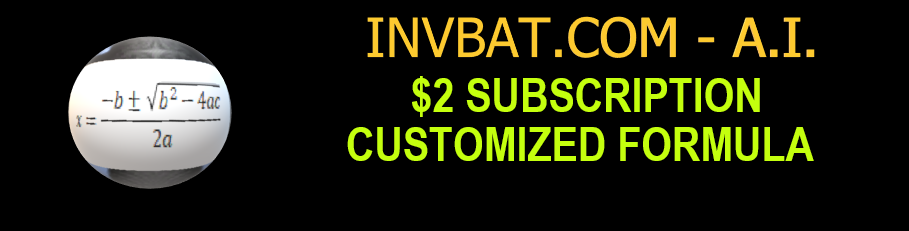
INVBAT.COM - AI revolutionizing education and how to remember using augmented intelligence.
Try typing or saying I need the quadratic formula
Try typing or saying get me the quadratic formula
Try typing or saying show me the quadratic formula
ASK WHAT YOU NEED. TRY I NEED QUADRATIC EQUATION
AI Natural Language Query makes one click search now possible
Enter your access code above or ask what you need
INVBAT.COM - A.I. + CHATBOT voice search for formula , calculator, reviewer, work procedure and frequently asked questions (FAQ). It is useful immediately and on demand using your smartphone, notebook, tablet, laptop or desktop computer. Helping you to learn faster and 98% never forget.
INVBAT.COM - AI + CHATBOT is a personalized natural language search and information retrieval augmented intelligence service provider. We deliver immediate usefulness at affordable cost to our subscriber such as students, teachers, parents, and employees to help them remember what they stored in the cloud in one or fewer click using their smartphone, tablet, laptop, desktop computer, and smart tv.

Advertising rate $375 per year
Additional bonus if your school , community college, and university advertise, all your students and teachers will get free personal memory assistant chatbot for one month.
Advertise on this webpage. Use PayPal
After payment e-mail admin@invbat.com your advertising website link or your You Tube link and we will insert them on this webpage.

# Author : Apolinario (Sam) Ortega - founder of invbat.com-A.I + chatbot <admin@invbat.com)
# Date created: 6/13/2020

# license : BSD 3 clause

# comment : Lesson 18 is my attempt to understand how pandas implement the .pivot_table method

import pandas as pd
import numpy as np
import seaborn as sns
import matplotlib.pyplot as plt

# comment # Do shift + enter
# comment : array must all be of the same length. Otherwise you will get error message

tips = pd.DataFrame({"Server_Name": ["Abby", "Abby", "Abby", "Nina", "Jarah",
                         "Nina", "Jay", "Adiel", "Sam","Abby", "Jana", "Excel", "Nina", "Jarah",
                         "Nina", "Jay", "Adiel", "Sam", "Abby", "Abby", "Abby", "Nina", "Jarah",
                         "Nina", "Jay", "Adiel", "Sam","Abby", "Jana", "Excel", "Nina", "Jarah",
                         "Nina", "Jay", "Adiel", "Sam"],

                   "Table_Size": ["one", "one", "one", "two", "two","one", "one", "two", "two", "one", "one",
                         "one", "two", "two", "one", "one", "two", "two", "one", "one", "one", "two", "two",
                         "one", "one", "two", "two", "one", "one", "one", "two", "two",
                         "one", "one", "two", "two"],

                   "Time": ["dinner", "lunch", "lunch", "dinner", "lunch", "dinner", "lunch", "dinner",
                         "dinner" , "dinner", "lunch", "lunch", "dinner", "lunch", "dinner", "lunch", "dinner",
                         "lunch", "dinner", "lunch", "lunch", "dinner", "lunch", "dinner", "lunch", "dinner",
                         "dinner" , "dinner", "lunch", "lunch", "dinner", "lunch", "dinner", "lunch", "dinner",
                         "lunch"],

                   "Day": ["Tuesday", "Tuesday", "Friday", "Saturday", "Saturday", "Saturday", "Sunday", "Sunday",
                         "Thurday" , "Tuesday", "Wednesday", "Friday", "Monday", "Monday", "Tuesday", "Thursday", "Friday",
                         "Saturday", "Sunday", "Sunday", "Thursday", "Tuesday", "Saturday", "Saturday", "Friday", "Friday",
                         "Monday" , "Monday", "Sunday", "Sunday", "Wednesday", "Monday", "Monday", "Saturday", "Friday",
                         "Sunday"],


                   "Sex": ["female", "male", "male", "female", "female", "female", "male", "male",
                         "male" , "female", "male", "male", "female", "female", "female", "male", "male","male",
                         "female", "male", "male", "female", "female", "female", "male", "male",
                         "male" , "female", "male", "male", "female", "female", "female", "male", "male","male"],


                   "Tips": [5, 5.5, 6, 5.25, 4.75, 4.25, 5.85, 6.45, 7.50 , 5, 5.5,
                            6, 5.25, 4.75, 4.25, 5.85, 6.45, 7.50, 5, 5.5, 6, 5.25, 4.75, 4.25, 5.85, 6.45, 7.50 , 5, 5.5,
                            6, 5.25, 4.75, 4.25, 5.85, 6.45, 7.50],

                   "Total_Bills": [50.24, 42.75, 58.25, 59.25, 68.20, 61.50, 87.35, 95.45, 96.30,
                                  50.24, 42.75, 58.25, 59.25, 68.20, 61.50, 87.35, 95.45, 96.30, 50.24, 42.75, 58.25, 59.25, 68.20, 61.50, 87.35, 95.45, 96.30,
                                  50.24, 42.75, 58.25, 59.25, 68.20, 61.50, 87.35, 95.45, 96.30]})
print('')
print('Shown below is not a real data set for restaurant X')

tips

# comment # Do shift + enter
# comment # Assuming you have this Excel spreadsheet. Now I want you to use .pivot_table to create specific analyis
# for example I want to know total tips received by each server name by table size and time of meal. Next Iteration
# comment : Show me how to use .pivot_table method to create a targeted analysis
print('')
print('Tip Summary Analysis for each Server Name by table size and time')
table = pd.pivot_table(tips, values='Tips', index=['Server_Name', 'Time'],
                    columns=['Table_Size'], aggfunc=np.sum)
table
# comment # Do shift + enter
# Now I want to analysis the total bills generated by each server name by table size and meal time. Next Iteration
# comment : Show me how to use .pivot_table method to create a targeted analysis
print('')
print('Total Bills Summary Analysis for each Server Name by table size and time')
table = pd.pivot_table(tips, values='Total_Bills', index=['Server_Name', 'Time'],
                    columns=['Table_Size'], aggfunc=np.sum)
table
# comment # Do shift + enter
# Now I want to know the tips received by server name by table size and sex. Next Iteration
# comment : Show me how to use .pivot_table method to create a targeted analysis
print('')
print('Total Bills Summary Analysis for each Server Name by table size and sex')
table = pd.pivot_table(tips, values='Tips', index=['Server_Name', 'Sex'],
                    columns=['Table_Size'], aggfunc=np.sum)
table
# comment # Do shift + enter
# comment: Show the plot of tips versus total bills

tips.plot(figsize=(12,4))

plt.legend(loc='upper right')
plt.title('Total Bills vs Tip ', size=14)
plt.xlabel('Tips', size =12)
plt.ylabel('Total Bills', size=12)

# comment # Do shift + enter

# comment:


sns.relplot(x="Tips", y="Total_Bills", hue="Time", size="Sex",
            sizes=(40, 400), alpha=.5, palette="muted",
            height=6, data=tips)

print('')
print('Total Bills vs Tips analyze by sex and time of meal')
print('Color hue orange is for lunch and blue for dinner')
print('Big diameter is for female and smaller for male')

# comment # Do shift + enter

# comment

sns.relplot(x="Total_Bills", y="Tips", col="Time",
            hue="Sex", style="Table_Size", size="Server_Name",
            palette="YlGnBu", markers=["D", "o"], sizes=(10, 305),
            edgecolor=".2", linewidth=.5, alpha=.75,
            data=tips);

# comment # Do shift + enter
# Below the column or fieldname use for filtering the analysis is the meal time (col = "time")
# Below the diamond marker (D) represent single table and circle represent two table
# The bigger the size of the marker means bigger tips
# Who among the server name got more total and least tips? Answer is Abby and Excel

# comment : I want to see the distribution of tip at what meal type and what days

g = sns.catplot(x="Tips", y="Day", hue="Time",
                height=3.5, aspect=1.5,
                kind="box", legend=False, data=tips);
g.add_legend(title="Meal Type")
g.set_axis_labels("Tip ($)", "")
g.set(xlim=(0, 12), yticklabels=["Monday", "Tuesday", "Wednesday","Thursday", "Friday", "Saturday", "Sunday"])
g.despine(trim=True)
g.fig.set_size_inches(9.5, 5.5)
g.ax.set_xticks([2, 4, 6, 8, 10, 12], minor=True);
plt.setp(g.ax.get_yticklabels(), rotation=30);
# comment # Do shift + enter

# comment : I want to see the correlation of Tips to Total Bills
ax = sns.regplot(x="Tips", y="Total_Bills", data=tips,
                 x_estimator=np.mean, logx=True)
# comment # Do shift + enter


INVBAT.COM - A.I. is a disruptive innovation in computing and web search technology. For example scientific calculator help us speed up calculation but we still need to remember accurately the formula and the correct sequence of data entry. Here comes the disruptive innovation from INVBAT.COM-A.I. , today the problem of remembering formula and the correct sequence of data entry is now solved by combining formula and calculation and make it on demand using smartphone, tablet, notebook, Chromebook, laptop, desktop, school smartboard and company big screen tv in conference room with internet connection.
For web search , INVBAT.COM-A.I, is demonstrating that you can type text or use voice to text A.I. to search the web and get direct answer in one or two clicks. You don't need to waste your time looking from million of search results.